Trait Weight Calculation
The rarity of tethered NFT assets in the metaverse is decided by numerous different traits; including colours, no. of accessories, types of accessories etc. We have established a new trait weighing system to randomize the traits.
When generating character and vehicle NFTs, traits are randomised but based on a weight system. Larger stakes will have a higher chance of acquiring rarer traits over common traits. Traits include things such as skin type, helmet, backpack, tattoos etc.
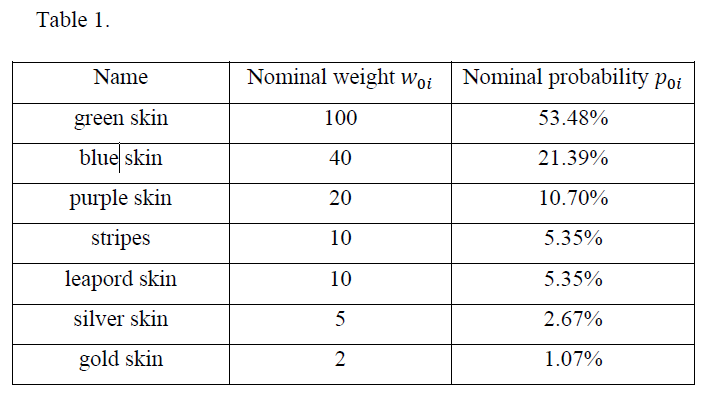
Let’s use skin traits as an example. In the below table, there are a total of 7 traits; these have been categorized into a tier based system (seen in the table). Traits are ranked based on their nominal weight and each weight has a corresponding nominal probability.
This method for calculating trait weights provides a simple and easy way to determine how rare is a trait compared to others. Rather than taking the rarest trait of each NFT or averaging their rarity, our algorithm calculates the trait weights.
If we take 𝑤𝑤0𝑖𝑖 to be the nominal weight of 𝑖𝑖-th trait (𝑖𝑖=1,2,…,7), then that corresponds to the case when the player’s stake is equal to the average stake. Then we have Table 1 (above) of nominal weights 𝑤𝑤0𝑖𝑖 (and nominal probabilities 𝑝𝑝0𝑖𝑖) for the trait skin:
To further refine calculations we introduce another parameter — x — to capture and convey the value of both the player’s stake and the average stake of players. If the player’s stake is less than the average stake (𝑥𝑥<1), then most likely ordinary traits will be generated. If the player’s stake is greater than the average stake (𝑥𝑥>1), then mostly rare traits will be generated.
Weights Traits Formula
The task is to find the functions 𝑤𝑤𝑖𝑖 = 𝑓𝑓(𝑤𝑤0𝑖𝑖, 𝑥𝑥) and 𝑝𝑝𝑖𝑖 = 𝑔𝑔(𝑤𝑤0, 𝑥𝑥), where 𝑤𝑤0 = {𝑤𝑤01, 𝑤𝑤02, … , 𝑤𝑤07} and
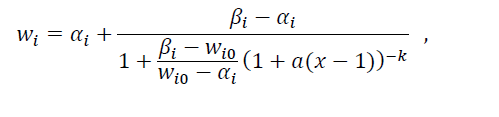
We are then presented with the following formula to calculate the trait weights:
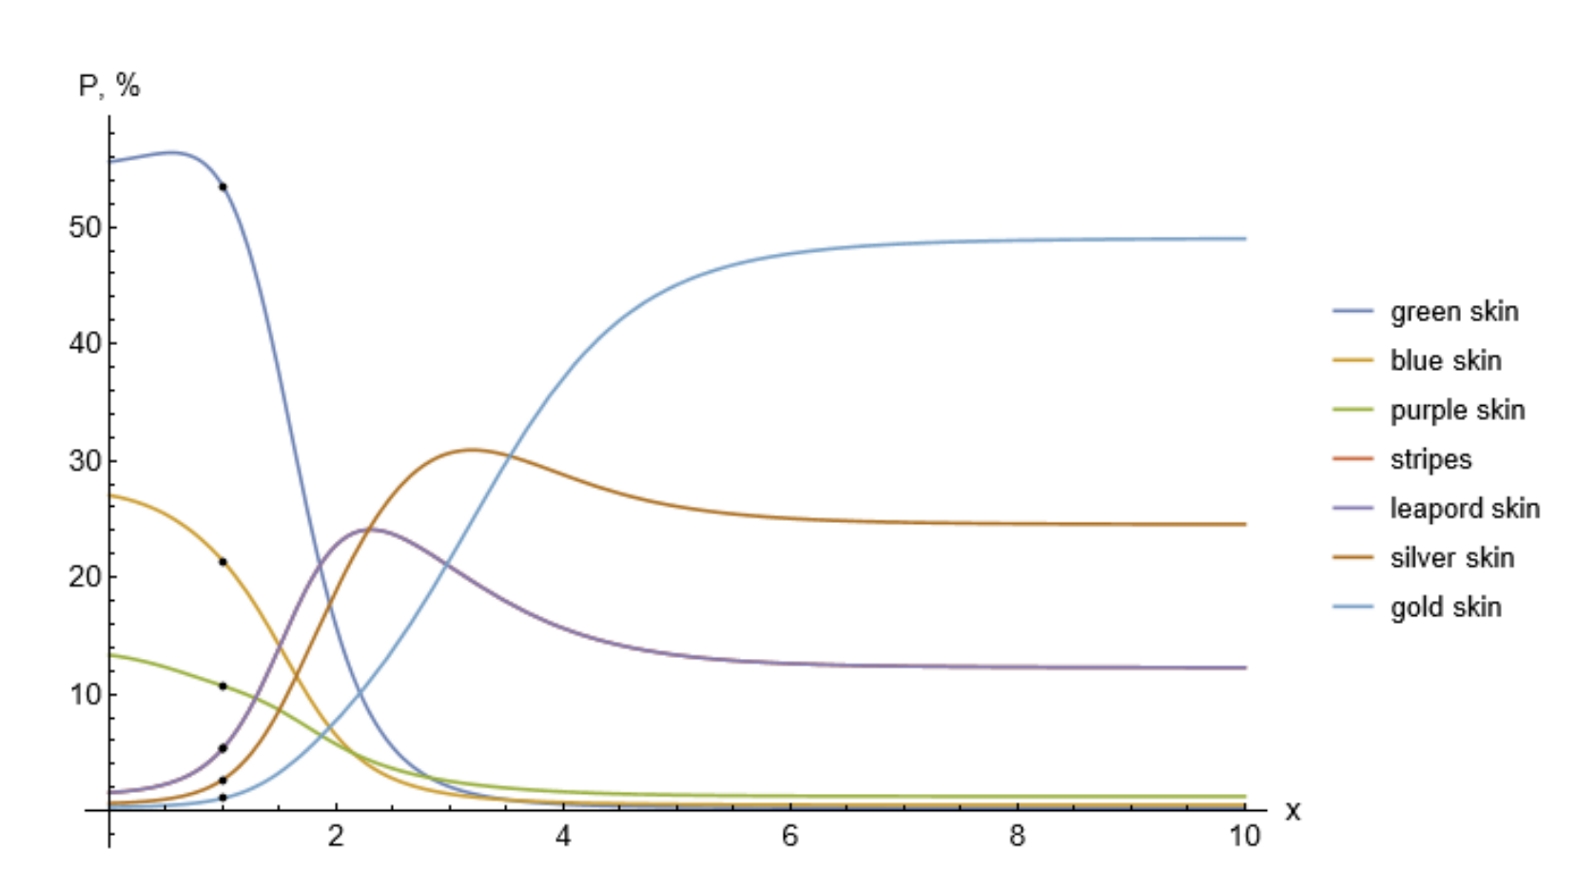
where 𝑘𝑘 > 0 and 𝑎𝑎 > 0 are scaling parameters, 𝛼𝛼𝑖𝑖 and 𝛽𝛽𝑖𝑖 are the same values from the Table 2. Using (7) for 𝑘𝑘 = 4 and 𝑎𝑎 = 0.5, we can build the plot Fig. 3. The behavior of the curves in Fig. 3 is similar to what was observed in Fig. 1 and 2. If we choose 𝑘𝑘 = 2 and 𝑎𝑎 = 0.25 we will get the plot shown in Fig. 4
Trait Weight calculations produce results that give enough emphasis to single rare traits and also include overall trait rarities in its calculation. And most importantly the results it gives match better with our human expectations.
While the calculation methods are the most core part of calculating the trait distribution, there are still many additional elements that are used to get the best final result.
Last updated